
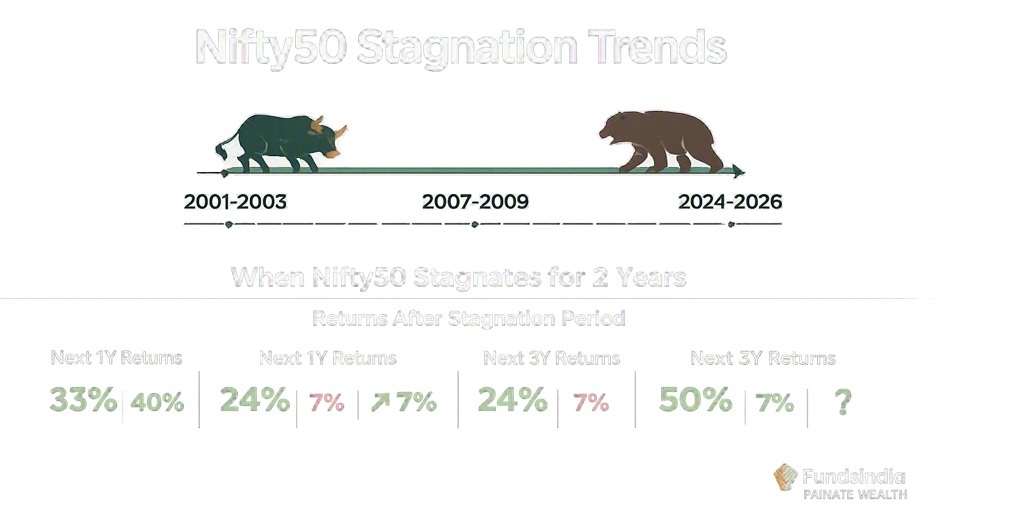
Insights from the Nifty50 Stagnation Data
- Stagnation ≠ Permanent Decline Even when the 2-year CAGR was flat or negative (e.g., 2007–2009, 2018–2020, 2024–2026), the subsequent 1-year or 3-year returns were often strongly positive.
- Sharp Recoveries After Stress
- June 2001–2003: CAGR ~1%, followed by 33% in the next year and 40% CAGR over 3 years.
- August 2018–2020: CAGR ~-1%, then 50% in the next year and 19% CAGR over 3 years.
- Pattern of Mean Reversion Markets tend to revert after prolonged stagnation, rewarding patient investors. This is consistent with global equity behaviour: flat stretches often build the base for the next rally.
- Current Context (2024–2026) The table shows a -4% CAGR over the last two years. The “Next 1Y” and “Next 3Y CAGR” are left blank, implying uncertainty. Historically, however, such drawdowns have often set the stage for recovery.
💡 Practical Implications
- Long-term investors benefit from staying invested during stagnation rather than trying to time exits.
- Systematic investing (SIPs) during flat periods can accumulate units at lower valuations, amplifying gains when recovery comes.
- Risk management is still crucial: while rebounds are common, the pace and magnitude vary depending on macroeconomic conditions.
The message is Stay Invested: Don’t Panic or show your frustration by selling or shifting to some other avenues as we don’t know when markets will start going up and It might happen within a short span too.
Happy Investing! Stay Invested!
RaVi
Standard Disclaimer: This is not an investment recommendation, note shared for education and information purpose only. Equity Investments are subject to Market Risk, please read all the documents before investing. Fund Wallet is an AMFI registered distributor of Mutual funds with registration number ARN-111231. Data Source given in the Image and Fund Wallet does not guarantee the authenticity of the same.
Leave a Reply